Latest Los Cabos Market Reports

Discover why Los Cabos continues to attract luxury buyers worldwide.

H1 2026 Market Report · Year-Over-Year Analysis
Christie's Real Estate Cabo

Los Cabos Real Estate
Market Report H1 2026

Baja California Sur  ·  H1 2026 vs H1 2025

The Luxury Market Is Evolving,
The Baja MLS Only Tells Part of the Story

The Los Cabos luxury real estate market continues to demonstrate long-term strength, supported by the region’s unique lifestyle, world-class communities, and continued demand from high-net-worth buyers. While the market has evolved, buyer behavior has shifted primarily in the under $1M USD segment, where increased inventory and some buyers waiting for more favorable interest rates have created a more selective environment.

In contrast, the ultra-luxury market above $4M USD remains resilient, with continued demand for exceptional properties in Los Cabos’ premier resort, golf, beachfront, and ocean-view communities. Although MLS-reported resale activity has adjusted compared to last year, Los Cabos continues to attract qualified buyers seeking one of the world’s most desirable luxury destinations.

What the MLS Shows
$670.9M
Total Sales Volume
▼ 25.2% vs H1 2025
797
Properties Sold
▼ 17.6% vs H1 2025
$842K
Avg. Sale Price
▼ 9.3% YoY · Mixed by Type
Total Sales Volume
H1 2026 vs H1 2025
Total market volume in USD · half-year over half-year
H1 2025
$897.5M
Baseline
H1 2026
$670.9M
▼ 25.2%

Today’s luxury buyers are becoming more selective. Many are comparing turnkey resale residences, limited developer inventory, branded residences, and premium homesites where they can design and build a custom home around their lifestyle.

Sales Breakdown by Property Type
194 Land Sold
$67.5M USD
▼ 21.1% units
▼ 27.2% volume
325 Condos Sold
$240.5M USD
▼ 17.5% units
▼ 0.9% volume
278 Homes Sold
$362.8M USD
▼ 15.0% units
▼ 35.4% volume
Total Sales Volume
$670.9M
▼ 25.2%
Homes
Avg. Price$1.3M
▼ 24.1% YoY
Condos
Avg. Price$740K
▲ 20.1% YoY
Land
Avg. Price$348K
▼ 7.6% YoY
All percentage data is comparing the same dates from the previous year.

At mid-year, MLS data shows reported sales volume down 25.2% and total sales down 17.6%. However, the average condo sale price is up 20.1%, reinforcing that the market is not defined by fewer transactions alone. Instead, the data points to a more selective market where quality, location, pricing, and presentation matter more than ever.
797
H1-2026 Total Closed
$670.9M
Total Sales Volume
$841,731
Avg. Sale Price USD
Sales Volume by Area
H1 2026 — All Zones
Total market volume in USD by property type and location
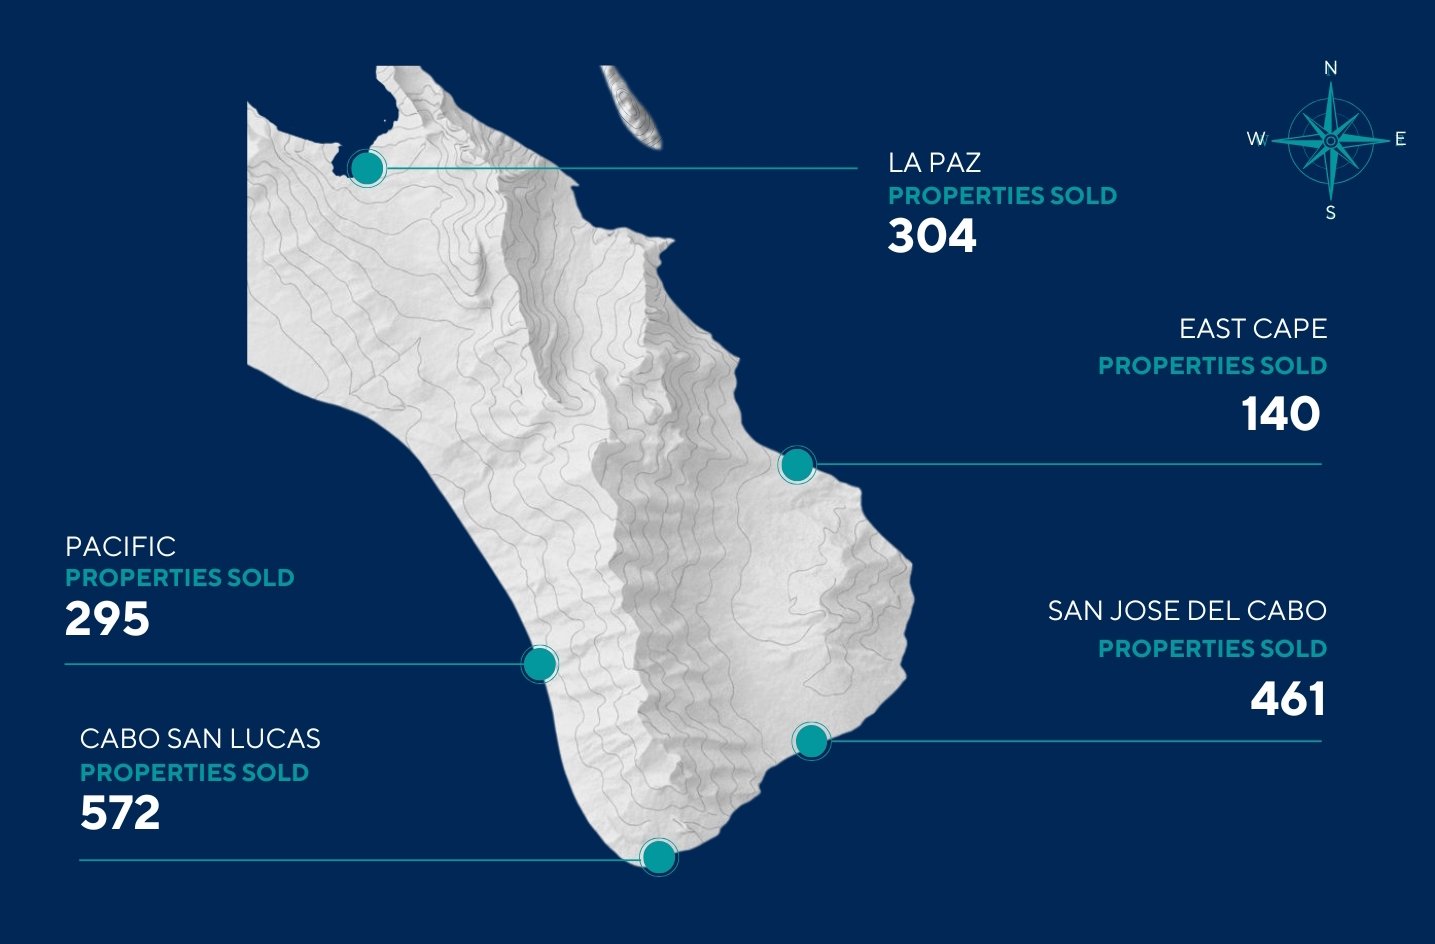
Cabo San Lucas San Jose Del Cabo Pacific East Cape La Paz Total
Homes $81.6M $170.5M $69.4M $15.2M $26.0M $362.8M
Condos $73.3M $127.5M $27.4M $520K $11.8M $240.5M
Land $5.6M $25.5M $17.5M $8.8M $10.2M $67.5M
Total $160.5M $323.5M $114.3M $24.6M $48.0M $670.9M
Market Trends by Property Type
Active Inventory & Sales Metrics
Average months of inventory shows the relationship between available properties and the pace of sales. Percentage changes shown on sold totals and sales prices compare H1 2026 (Jan–Jun) to the same six-month period a year earlier, H1 2025.
Note: The figures below reflect MLS-reported resale activity only. They do not include off-MLS developer sales, presales, or branded residence transactions, which represent a significant share of total market activity in Los Cabos — see “What The MLS Does Not Show” later in this report for additional context.
Total Sales Volume
Year Over Year Report
Annual market volume in USD · Los Cabos & Baja California Sur

Method note: Sold metrics are based on H1 2026 (Jan 1–Jun 30) closed sales across the five Los Cabos & Baja California Sur markets shown above. Months of supply is calculated from active listings divided by average monthly solds over the six-month period. Coverage used: Cabo Corridor, Cabo San Lucas, San Jose Corridor, San Jose del Cabo, East Cape, Pacific, and La Paz. Loreto, Comondú, and Mulegé are excluded from all figures in this report.

Now, What The MLS Does Not Show

For many buyers, the decision now comes down to comparing the cost and time required to renovate and furnish a resale property versus building a brand new home tailored to their lifestyle. Building new can offer meaningful value, choosing modern design, preferred finishes, ocean views, outdoor living, and amenities that reflect how you want to live.

This is especially important in Cabo, where each community can vary significantly in privacy, beach access, club amenities, build timelines, HOA structure, and long-term value. Publicly available MLS data only tells part of the story, as new construction, homesites, custom residences, pending transactions, and development inventory are not always reflected.

$670.9M MLS
$500M+ Tracked Developer Activity
Illustrative market view: H1 2026 MLS + tracked off-MLS developer activity
The Luxury Market is Moving in Two Lanes

MLS data shows one side of the market. Developer inventory, branded residences, and private community presales show another. Together, they are shaping pricing, buyer behavior, and future construction demand throughout Los Cabos. Much of this activity takes place within highly sought-after resort, golf, and ocean-view communities, where availability, pricing, privacy, and long-term value require a more informed perspective.

Community / Project — Estimated Developer Activity
Cabo Real
$100M+ Developer sales this year
Chileno Bay
$200M+ Developer sales this year
Maravilla
$100M Developer sales this year
Cove Club
$100M Developer sales this year
Park Hyatt
$60M Developer sales this year
Soho Club / Cabo del Sol
$50M+ Reservations this year
Total Sales Not on the MLS
$500M+ Developer sales this year

MLS-reported data does not include all developer sales, private inventory, or off-market transactions. Several major master-planned communities and branded residential developments in Los Cabos sell a portion of their inventory through developer sales teams, and those transactions may not appear in MLS statistics. Examples include select inventory within Quivira, Diamante, Maravilla, Montage Residences, Chileno Bay, Costa Palmas, and other luxury developments.
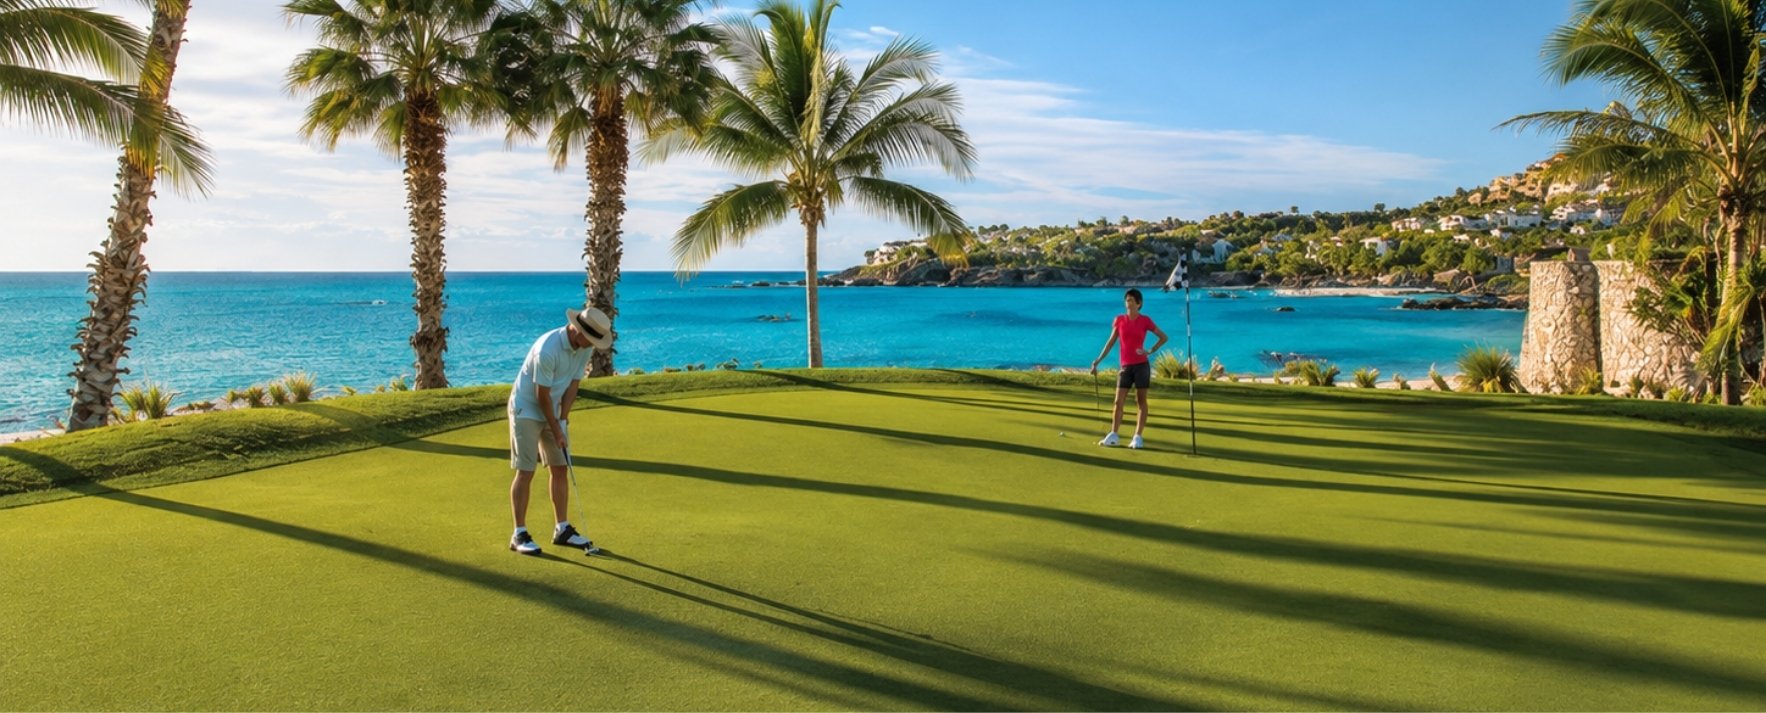
Today’s Los Cabos market is increasingly lifestyle-driven, with buyers investing in far more than a home. They’re choosing private resort communities that offer ocean views, unique landscapes, international accessibility, championship golf, beach clubs, boating, wellness, fine dining, concierge services, and an exceptional quality of life, creating a complete living experience that continues to attract discerning buyers from the U.S., Canada, and around the world.

Local Experts. Global Network.
Discover the latest luxury listings, premier communities, and market insights—all in one place.

This is where experienced representation matters. A knowledgeable luxury brokerage provides a broader view of the market, including opportunities that may not appear on the active MLS map. That perspective helps buyers evaluate options objectively, understand true value, and make confident decisions aligned with their lifestyle and investment goals.
Annual Performance & Year-Over-Year Analysis


2025 Year-End Market Report + 2026 Outlook
Oceanside Real Estate Group

Los Cabos Real Estate
Market Report 2025

Baja California Sur  ·  Annual Performance & Year-Over-Year Analysis

 
$1.59B
Total Sales Volume
▲ 12.0% vs 2024
1,834
Properties Sold
▲ 12.0% YoY
$854K
Avg. Sale Price
▲ Strong Demand
Baja Sur — Annual Sales Volume (2015–2025)
Total market volume in USD · year over year
$286M
 
 
2015
$353M
▲23.4%
 
2016
$420M
▲19.0%
 
2017
$363M
▼13.6%
 
2018
$505M
▲39.1%
 
2019
$404M
▼20.0%
 
2020
$1.60B
▲296%
 
2021
$1.50B
▼6.25%
 
2022
$1.68B
▲12.0%
 
2023
$1.42B
▼15.5%
 
2024
$1.59B
▲12.0%
 
2025
2015–2020 2021–2024 2025
2025 Baja Sur real estate performance chart
Type
Cabo San Lucas
San Jose del Cabo
Pacific
East Cape
La Paz
 
Homes
$175.5M
$418.9M
$192.7M
$49.4M
$47.9M
Condos
$181.0M
$186.9M
$54.6M
$912.5K
$24.5M
Land
$17.9M
$105.9M
$30.4M
$15.6M
$22.4M
Total
$374.5M
$711.8M
$277.8M
$65.9M
$94.8M
$918M
Home Sales Total
639
Home Transactions
1,834
Total Properties Sold
$854,409
Avg. Sale Price USD
Houses Average sale price (USD)
Area
2024
2025
Change
Cabo Corridor
$989,585
$1,090,191
+10.2%
Cabo San Lucas
$1,758,251
$1,369,020
-22.1%
San Jose del Cabo
$1,510,340
$1,148,943
-23.9%
San Jose Corridor
$4,267,311
$5,882,983
+37.9%
Condos Average sale price (USD)
Area
2024
2025
Change
Cabo Corridor
$542,930
$506,082
-6.8%
Cabo San Lucas
$526,490
$437,132
-17.0%
San Jose del Cabo
$675,987
$747,873
+10.6%
San Jose Corridor
$1,874,238
$1,317,434
-29.7%
Land Average sale price (USD)
Area
2024
2025
Change
Cabo Corridor
$1,984,618
$655,520
-67.0%
Cabo San Lucas
$504,131
$236,627
-53.1%
San Jose del Cabo
$694,570
$604,905
-12.9%
San Jose Corridor
$1,140,377
$1,764,650
+54.7%

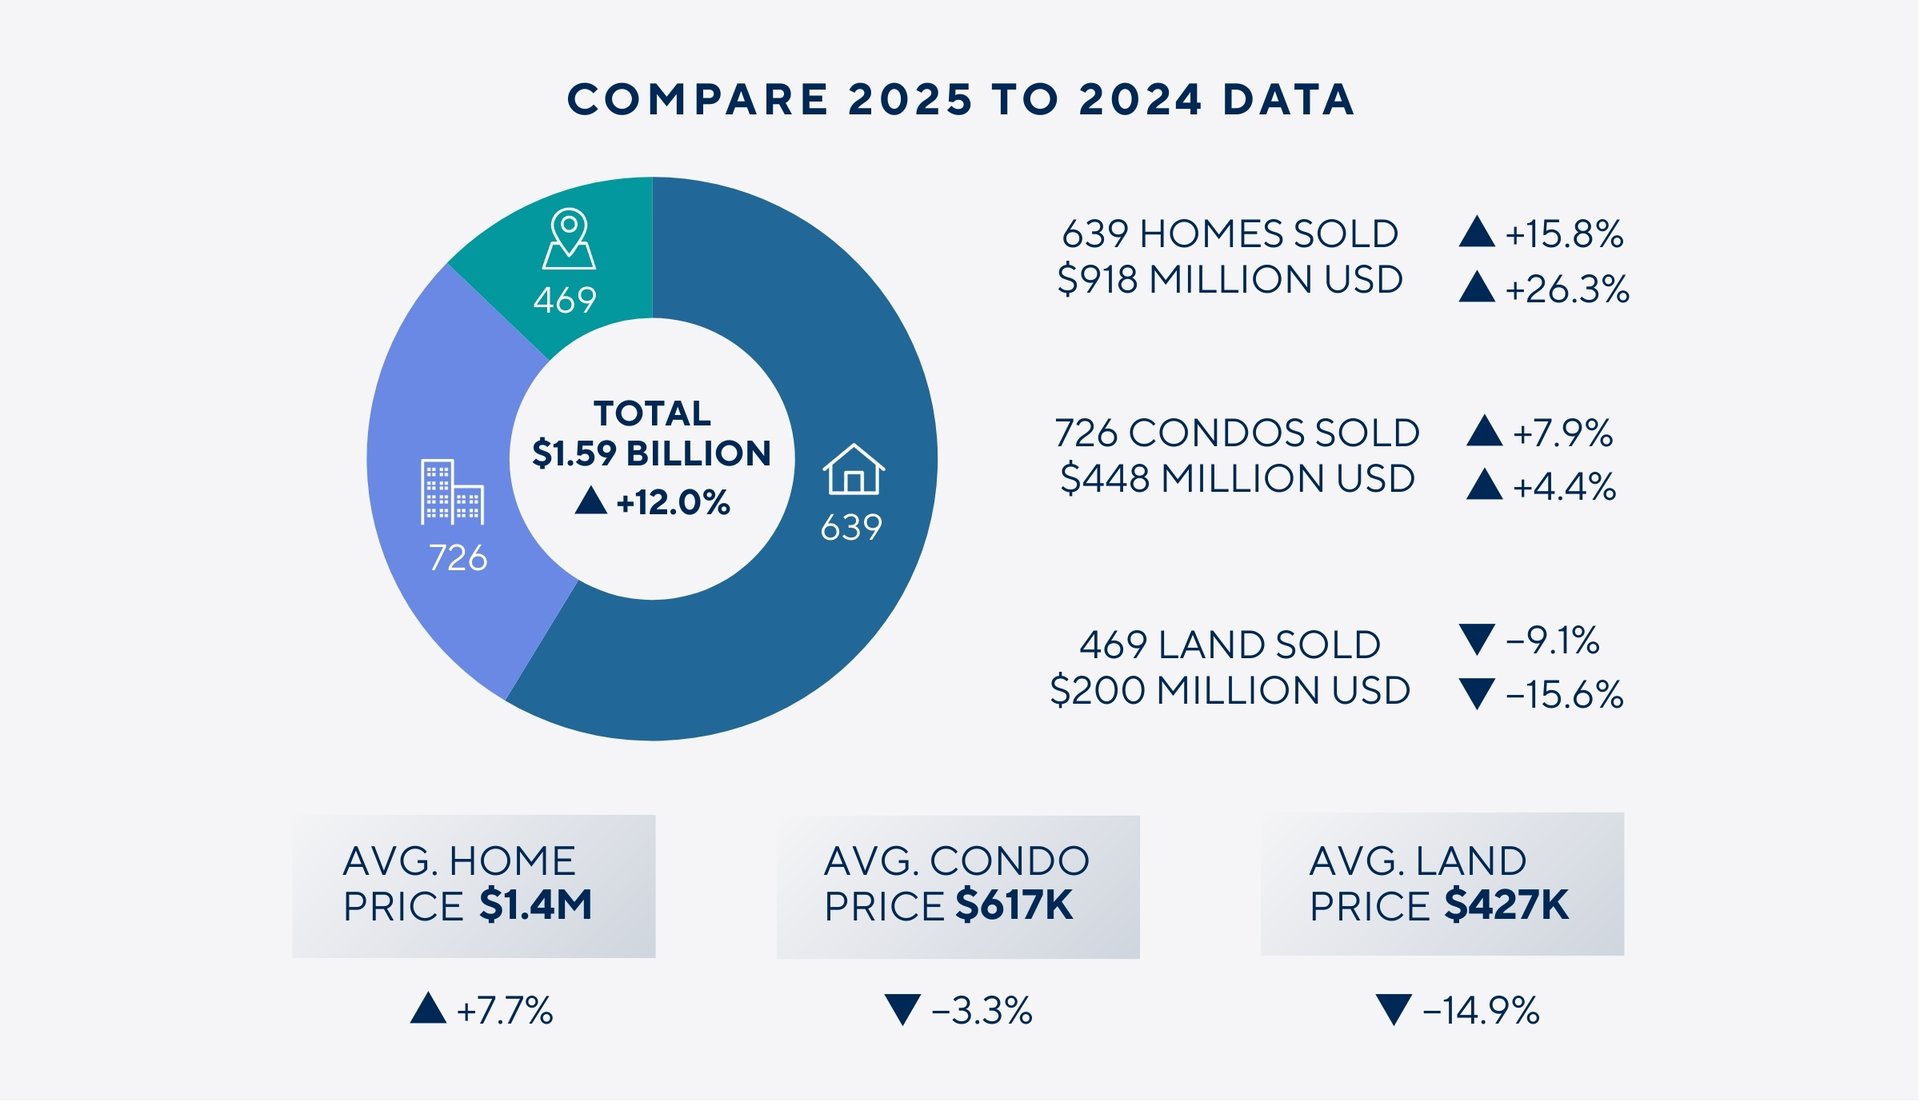
The 2025 Baja Sur real estate market showed solid growth compared to 2024, with total sales reaching $1.59 billion, up 12%. Home sales led the market with 639 transactions totaling $918 million, reflecting strong demand and price appreciation.

Land sales declined year over year, signaling a clear shift toward finished residences. Rising home prices and steady buyer activity highlight a resilient and maturing market across Baja Sur.

Is Los Cabos a Buyer's Market Entering 2026?
Market dynamics & forward outlook

Los Cabos operates within a unique, largely cash-driven real estate market, allowing owners to hold property long term without financing pressure while paying low annual property taxes. Over the past five years, more than $10 billion USD has been invested in the region, creating sustained momentum for buyers seeking both lifestyle and long-term investment value.

In some segments the market can feel like a buyer's market — but this is highly product- and location-specific. A large number of condominiums priced under $1 million have recently been delivered in select areas, creating higher inventory and more choice in those submarkets. In contrast, luxury single-family homes with ocean views remain extremely limited.

Construction costs commonly range between $500–$1,000 per square foot or more. As high-quality land becomes harder to acquire, scarcity places additional upward pressure on replacement costs and supports resale values for existing homes and condominiums.

Seller Insights
Why pricing & positioning matter in 2026

Homes priced in line with current sold comparative market data and positioned competitively are selling — while aspirational pricing is leading to longer days on market. Buyer demand remains active, but decisions today are driven by value, lifestyle, and pricing accuracy.

There is double the inventory in the market compared with two years ago, and today's buyers are informed and selective — comparing real sold data, value per square foot, condition, and lifestyle offering. It's a strategy-driven market.

Amenity-rich luxury communities continue to outperform when priced and presented correctly. Extended days on market often signal a pricing or positioning mismatch — not a lack of interest.

2024 Year-End Market Report + 2025 Outlook
Oceanside Real Estate Group

Los Cabos Real Estate
Market Report 2024

Baja California Sur  ·  Annual Performance & Year-Over-Year Analysis

 
$1.42B
Total Sales Volume
▼ 15.5% vs 2023
1,854
Properties Closed
Across All Property Types
$769K
Avg. Sale Price
▲ 13% vs 2023
Baja Sur — Annual Sales Volume (2015–2024)
Total market volume in USD · year over year
$286M
 
 
2015
$353M
▲23.4%
 
2016
$420M
▲19.0%
 
2017
$363M
▼13.6%
 
2018
$505M
▲39.1%
 
2019
$404M
▼20.0%
 
2020
$1.60B
▲296%
 
2021
$1.50B
▼6.25%
 
2022
$1.68B
▲12.0%
 
2023
$1.42B
▼15.5%
 
2024
Type
Cabo San Lucas
San Jose del Cabo
Pacific
East Cape
La Paz
 
Homes
$158.3M
$327.3M
$148.1M
$38.6M
$48.8M
Condos
$183.4M
$183.3M
$37.8M
$1.3M
$20.2M
Land
$84.9M
$62.0M
$46.4M
$26.7M
$16.1M
Total
$426.7M
$572.6M
$232.3M
$66.7M
$85.2M
$727.3M
Home Sales Total
552
Home Transactions
1,854
Total Properties Sold
$768,554
Avg. Sale Price USD
Houses 552 sold  ·  $727,257,107 total  ·  Avg $1,317,494
Cabo San Lucas $158,343,257
San Jose del Cabo $327,284,716
Pacific $148,082,865
East Cape $38,631,067
La Paz $48,823,642
Condos 673 sold  ·  $429,550,205 total  ·  Avg $638,261
Cabo San Lucas $183,413,336
San Jose del Cabo $183,315,712
Pacific $37,842,999
East Cape $1,347,500
La Paz $20,220,108
Land 516 sold  ·  $237,821,479 total  ·  Avg $502,632
Cabo San Lucas $84,939,908
San Jose del Cabo $62,028,351
Pacific $46,377,093
East Cape $26,657,075
La Paz $16,143,792

The 2024 Baja Sur real estate market closed with total sales of $1.42 billion across 1,854 properties, reflecting a 15.5% decline in volume from 2023 — yet average sale prices rose 13%, reaching $768,554. House sales led price appreciation with a 26% increase in average sale price to $1.32 million.

San Jose del Cabo was the top-performing region at $572.6M in total volume, while Cabo San Lucas drove strong luxury demand. A mid-year slowdown driven by election uncertainty and limited move-in-ready inventory gave way to renewed momentum as new turn-key communities came to market.

Is Los Cabos a Buyer's Market Entering 2025?
Market dynamics & forward outlook

Los Cabos operates within a unique, largely cash-driven real estate market, allowing owners to hold property long term without financing pressure while paying low annual property taxes. Over the past five years, more than $10 billion USD has been invested in the region, creating sustained momentum for buyers seeking both lifestyle and long-term investment value.

Building costs have risen sharply, with luxury construction now ranging from $500–$675 per square foot, and high-end custom homes exceeding $1,000 per square foot. This is driving motivated sellers to list move-in-ready homes, creating a surge in turn-key inventory and fresh opportunities for buyers.

Buyer intent remained strong throughout 2024 — the question was never whether to buy in Los Cabos, but how much to invest. Conversations consistently revealed that the region's appeal as a premier destination for luxury living and smart investment never wavered.

Seller Insights
Why pricing & positioning matter in 2025

Despite the year-over-year volume dip, homes priced in line with current sold comparative market data and positioned competitively are selling — while aspirational pricing led to longer days on market. Buyer demand remained active, driven by value, lifestyle, and pricing accuracy.

New community developments offering golf courses, beach clubs, and strong lifestyle amenities attracted buyers upgrading from older properties. This inventory shift created both challenges and opportunities for sellers across all price segments.

Amenity-rich luxury communities continue to outperform when priced and presented correctly. Extended days on market often signal a pricing or positioning mismatch — not a lack of interest.

2023 Year-End Market Report + 2024 Outlook
Oceanside Real Estate Group

Los Cabos Real Estate
Market Report 2023

Baja California Sur  ·  Annual Performance & Year-Over-Year Analysis

 
$1.68B
Total Sales Volume
▲ 12.0% vs 2022
2,425
Properties Closed
Across All Property Types
$678K
Avg. Sale Price
▲ Strong Demand
Baja Sur — Annual Sales Volume (2015–2023)
Total market volume in USD · year over year
$286M
 
 
2015
$353M
▲23.4%
 
2016
$420M
▲19.0%
 
2017
$363M
▼13.6%
 
2018
$505M
▲39.1%
 
2019
$404M
▼20.0%
 
2020
$1.60B
▲296%
 
2021
$1.50B
▼6.25%
 
2022
$1.68B
▲12.0%
 
2023
Type
Cabo San Lucas
San Jose del Cabo
Pacific
East Cape
La Paz
 
Homes
$257.4M
$394.2M
$706.4M
$1.4M
$192.7M
Condos
$240.6M
$381.1M
$222.4M
$9.8M
$23.6M
Land
$26.1M
$317.6M
$589.7M
$1.1M
$0.8M
Total
$766.6M
$1.14B
$1.53B
$992.8M
$757.9M
446
Cabo San Lucas
$766.6M
400
San Jose del Cabo
$1.14B
354
Pacific
$1.53B
233
East Cape
$992.8M
303
La Paz
$757.9M
$679.8M
Home Sales Total
652
Home Transactions
2,425
Total Properties Sold
$678,107
Avg. Sale Price USD
Houses 652 sold  ·  $679,293,627 total
Cabo San Lucas $257,420,448
San Jose del Cabo $394,181,100
Pacific $706,376,423
East Cape $1,378,889
La Paz $192,665,136
Condos 1,114 sold  ·  $752,478,684 total
Cabo San Lucas $240,558,399
San Jose del Cabo $381,057,018
Pacific $222,445,153
East Cape $9,751,500
La Paz $23,611,568
Land 659 sold  ·  $230,648,522 total
Cabo San Lucas $26,126,900
San Jose del Cabo $317,564,849
Pacific $589,675,089
East Cape $1,130,350
La Paz $842,608

The 2023 Baja Sur real estate market reached $1.68 billion in total sales across 2,425 closed properties — a 12% increase over 2022 and a new high watermark for the region. Condos led by transaction volume with 1,114 units sold, while homes and land rounded out a balanced, high-demand market.

Los Cabos continues to be the most active and highly demanded real estate market in Mexico, proving why expats and international buyers are choosing to make the move. With the luxury segment stabilizing after 30–40% appreciation in prior years, 2023 demonstrated consistent, sustainable growth momentum entering 2024.

Why Los Cabos Continues to Outperform
Market dynamics & forward outlook

The market in Baja California Sur continues to grow, reassuring investors and giving them the confidence to keep building an even greater community for full-time residents and vacationers alike. After seeing appreciation of 30–40% or more over the prior years depending on amenities and community, the market has reached a healthy stabilization point — a sign of maturity, not slowdown.

What real estate investors love about Cabo is its close proximity to the US, exceptional weather, safety, and the fact that it operates primarily as a cash market with low annual property taxes. Limited inventory continues to drive momentum, with more people discovering Los Cabos than ever before.

Those who want to sell are largely looking to move up — investing into bigger properties or new communities with greater amenities. Strong and consistent growth, combined with a world-class lifestyle offering, continues to attract buyers seeking both a place to retire and a smart long-term investment.

Seller Insights
Why pricing & positioning matter in 2024

With the luxury market stabilizing after years of rapid appreciation, sellers in 2023 found success by pricing competitively against current sold comparables. Buyers have become more discerning, comparing value per square foot, condition, and lifestyle offering — making accurate pricing and strong presentation essential.

Demand for move-in-ready homes in amenity-rich communities remained robust throughout the year. Sellers who positioned their properties within these communities — particularly those offering golf, beach clubs, and strong lifestyle infrastructure — saw the strongest results.

The question for buyers was never whether to invest in Los Cabos — it was how much to invest and where. That confidence in the region remains one of its greatest strengths heading into 2024.

main

How Can I Own Property in Los Cabos as A Foreiner?

Owning a Vacation home in Los Cabos is like a dream come true and easier than ever before, and the Oceanside Real Estate Group is happy to explain how the process works so you can feel comfortable making the next steps as choose where you want to spend your time.
Here is some information to know before purchasing your new Cabo vacation home:

1. Foreigners US/CA citizens can purchase property in Los Cabos with a Fideicomiso…

2. What is a Fideicomiso? It is a Mexican Bank Trust which allows foreign citizens to purchase coastal property within designated regions of Mexico, this is an instrument used for non-Mexican nationals, such as U.S. citizens and Canadians to purchase property in Cabo.

3.How does the Bank Trust Work? – The Mexican Government issues a permit to a Mexican Bank allowing the bank to act as the purchaser of the property.

main

What About the Price per Square Foot?

For several reasons the price per square foot in Los Cabos can be tough to determine, here’s why:

  • Established communities vs pre-construction pricing.
  • Many properties feature large outdoor living spaces that are not included when calculating square footage.
  • Variable factors include area, gated neighborhoods, proximity to beach, amenities, beach clubs, restaurants, golf courses, security and privacy.
  • An average building construction price per sq in cabo starts close to $200 a Sq ft depending on the details and finishes. However, some oceanfront developments can be up to $1400 sq ft or more depending on the property.

INVEST IN LOS CABOS

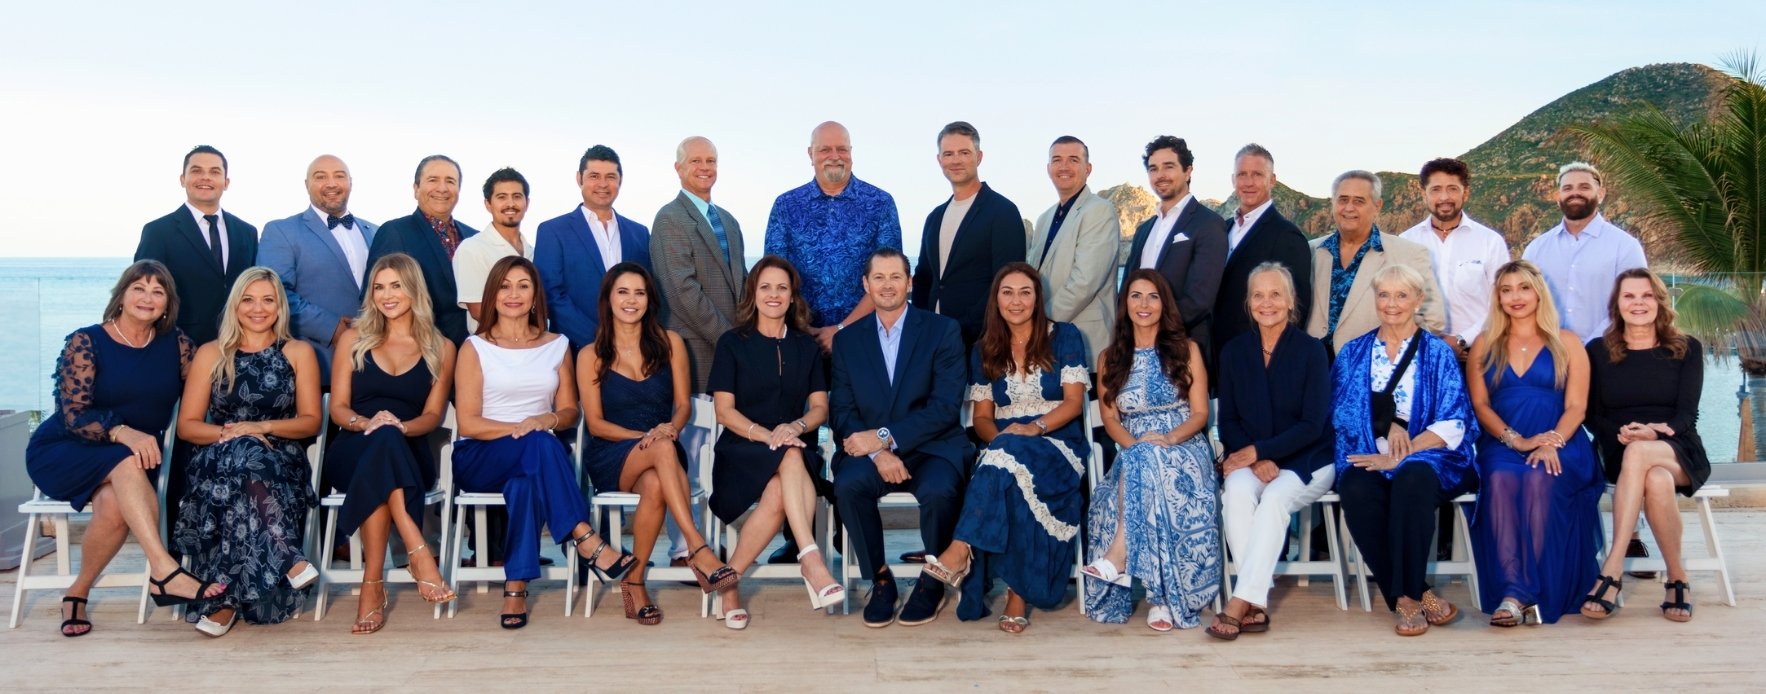
Our success is built on a carefully curated team of real estate advisors dedicated to honesty, integrity, and exceptional client service. Let’s Match Your Vision with The Perfect Property